This TradingView review will explore if it could be the ultimate charting platform that can handle all your trading needs across multiple asset classes.
As someone who has used TradingView extensively over the years, I’m here to give you an honest and detailed Tradingview Review that dives deep into why I believe it’s the best overall charting software available today.
This review will walk you through everything you need to know—from pricing plans and charting features to screeners, alerts, broker integrations, and more. By the end, you’ll have a solid understanding of whether TradingView is the right platform for your trading or investing Needs.
Why TradingView Stands Out as the Best Charting Platform
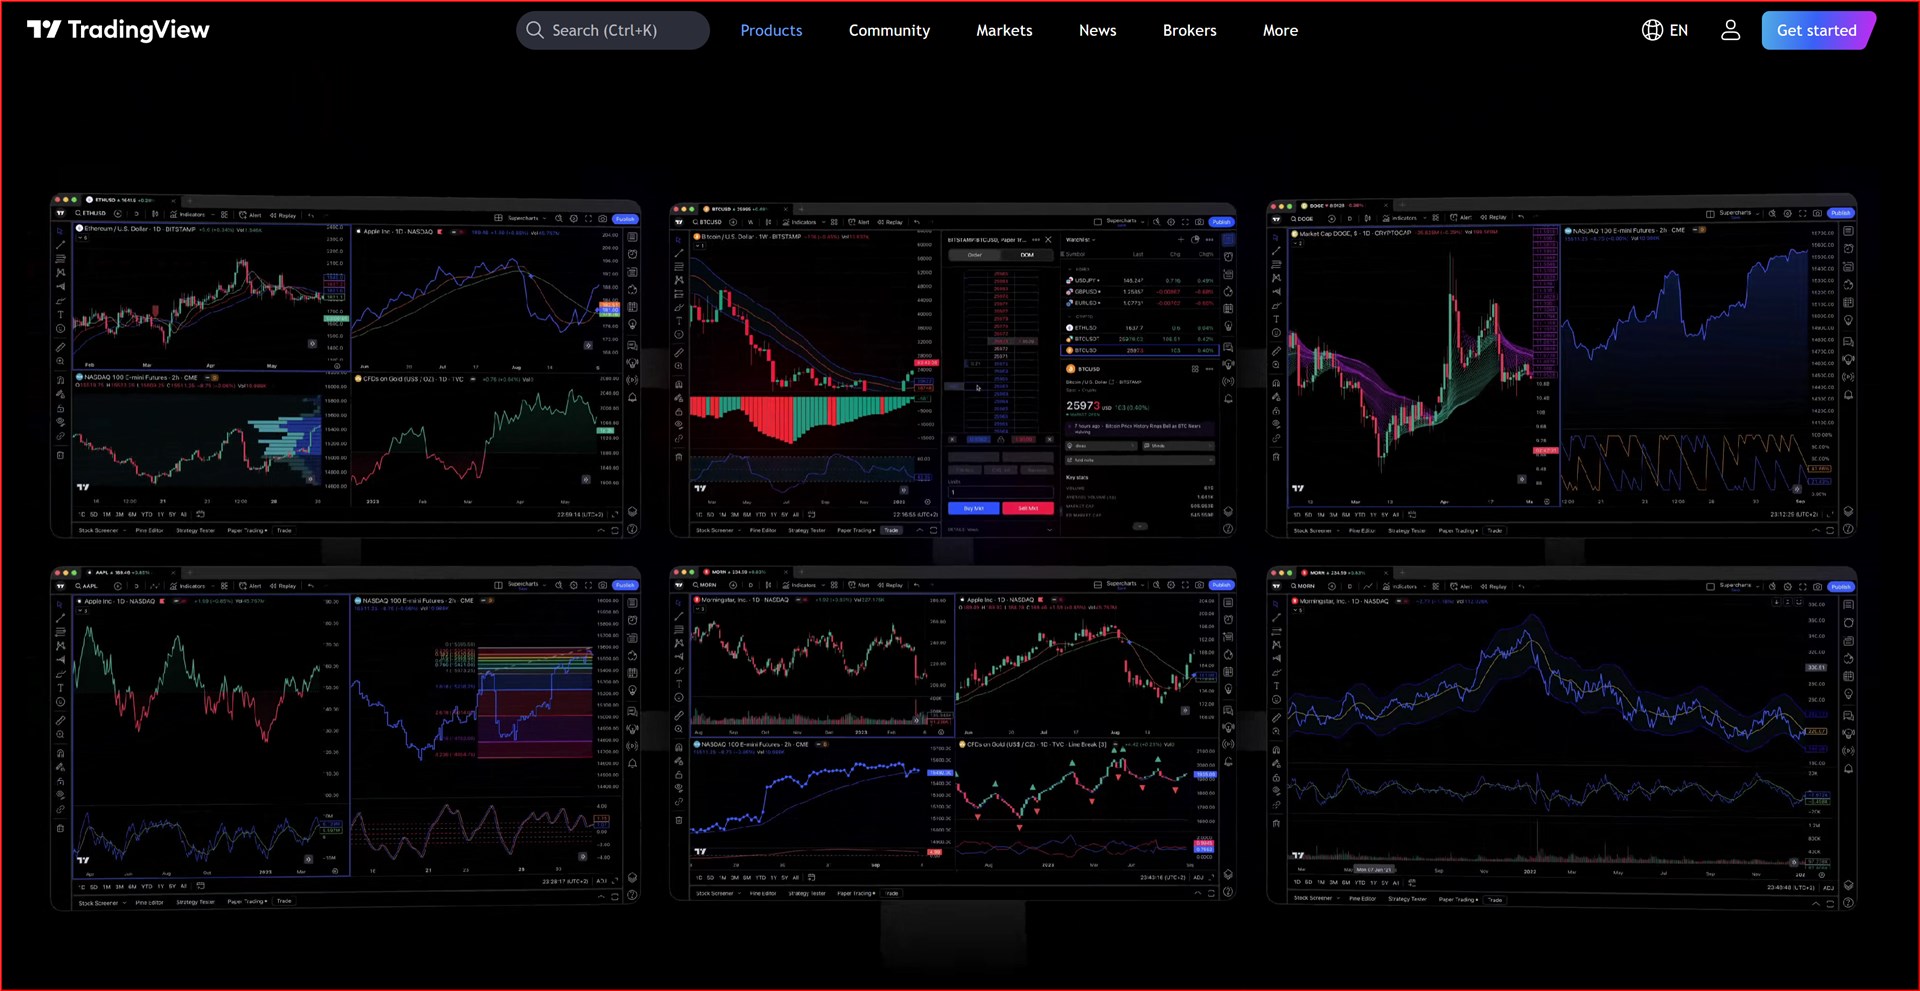
TradingView is unique because it offers charting tools across a vast range of asset classes all in one place. Whether you trade stocks, crypto, futures, forex, or even want to analyze multiple asset classes on a single platform, TradingView makes it effortless.
Try Tradingview For Free
You can try Tradingview for free for 30 days. Test it out and see if it suits your trading or investing style.
TradingView also integrates modern innovations such as AI-powered auto chart pattern recognition, which helps traders spot technical setups automatically.
Advanced indicators like volume profile, market profile, and footprint charts are also available, providing deeper insights. These tools are typically only accessible on specialized futures platforms.
Tradingview Chart Features
One of TradingView’s main strengths lies in its intuitive and powerful charting interface. The platform offers an extensive suite of drawing tools that make technical analysis accessible and customizable for traders of all styles.
Tradingview Drawing Tools
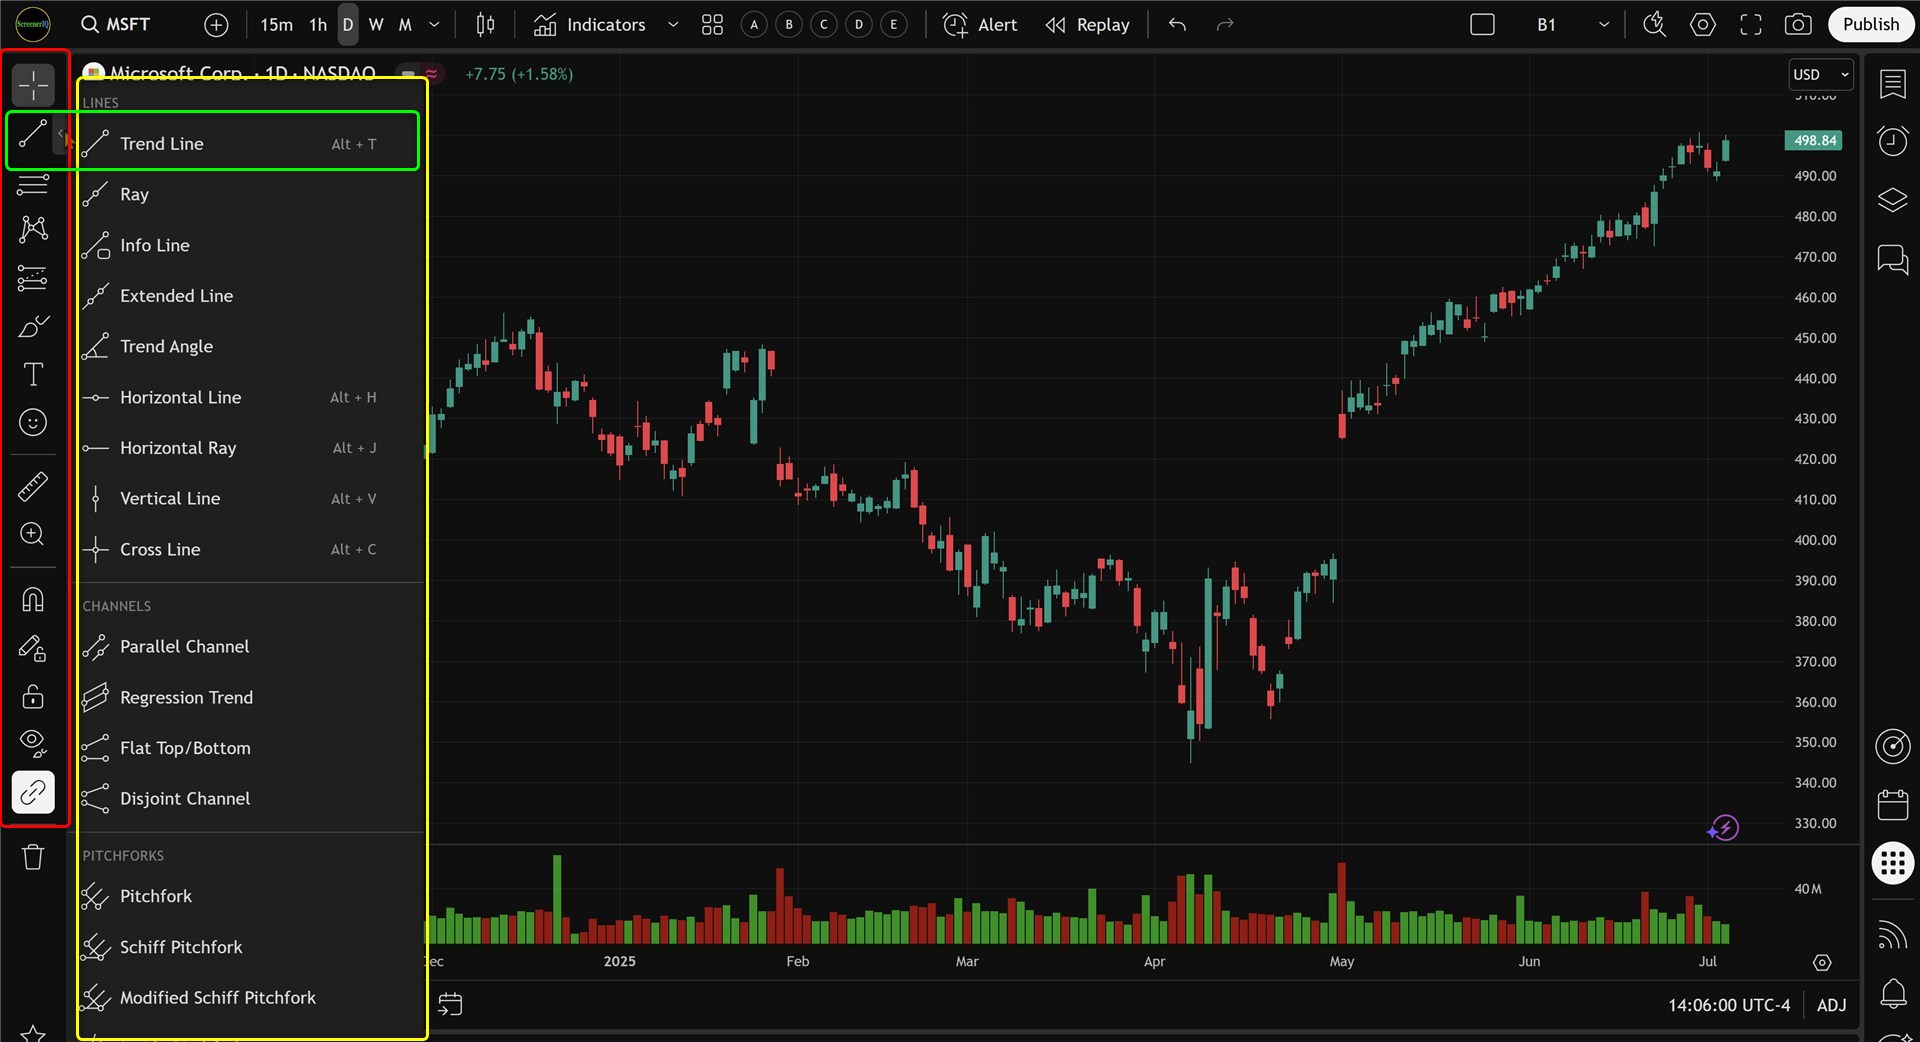
The drawing toolbar is conveniently located on the left side of the chart. If it’s hidden, you can enable it through the sidebar. Here are some of the key drawing tools you’ll find:
- Trend Lines: Easily draw and adjust trend lines with click-and-drag functionality. You can customize line thickness, color, and add alerts when price crosses them.
- Rays: Similar to trend lines but extend indefinitely in one direction.
- Parallel Channels: Quickly create channels to visualize price ranges.
- Brushes, Highlighters, Arrows, Rectangles: Useful for marking charts with annotations and highlighting key areas.
- Text, Callouts, Comments, Images, Emojis: Add rich notes directly on your charts to keep track of your ideas or share them with others.
- Anchored VWAP: Anchors volume-weighted average price from any point on the chart, helping to identify key support and resistance levels.
Fibonacci retracements are also easily accessible from the toolbar, allowing you to draw retracement levels by selecting a high and low point on the chart.
Tradingview Indicators
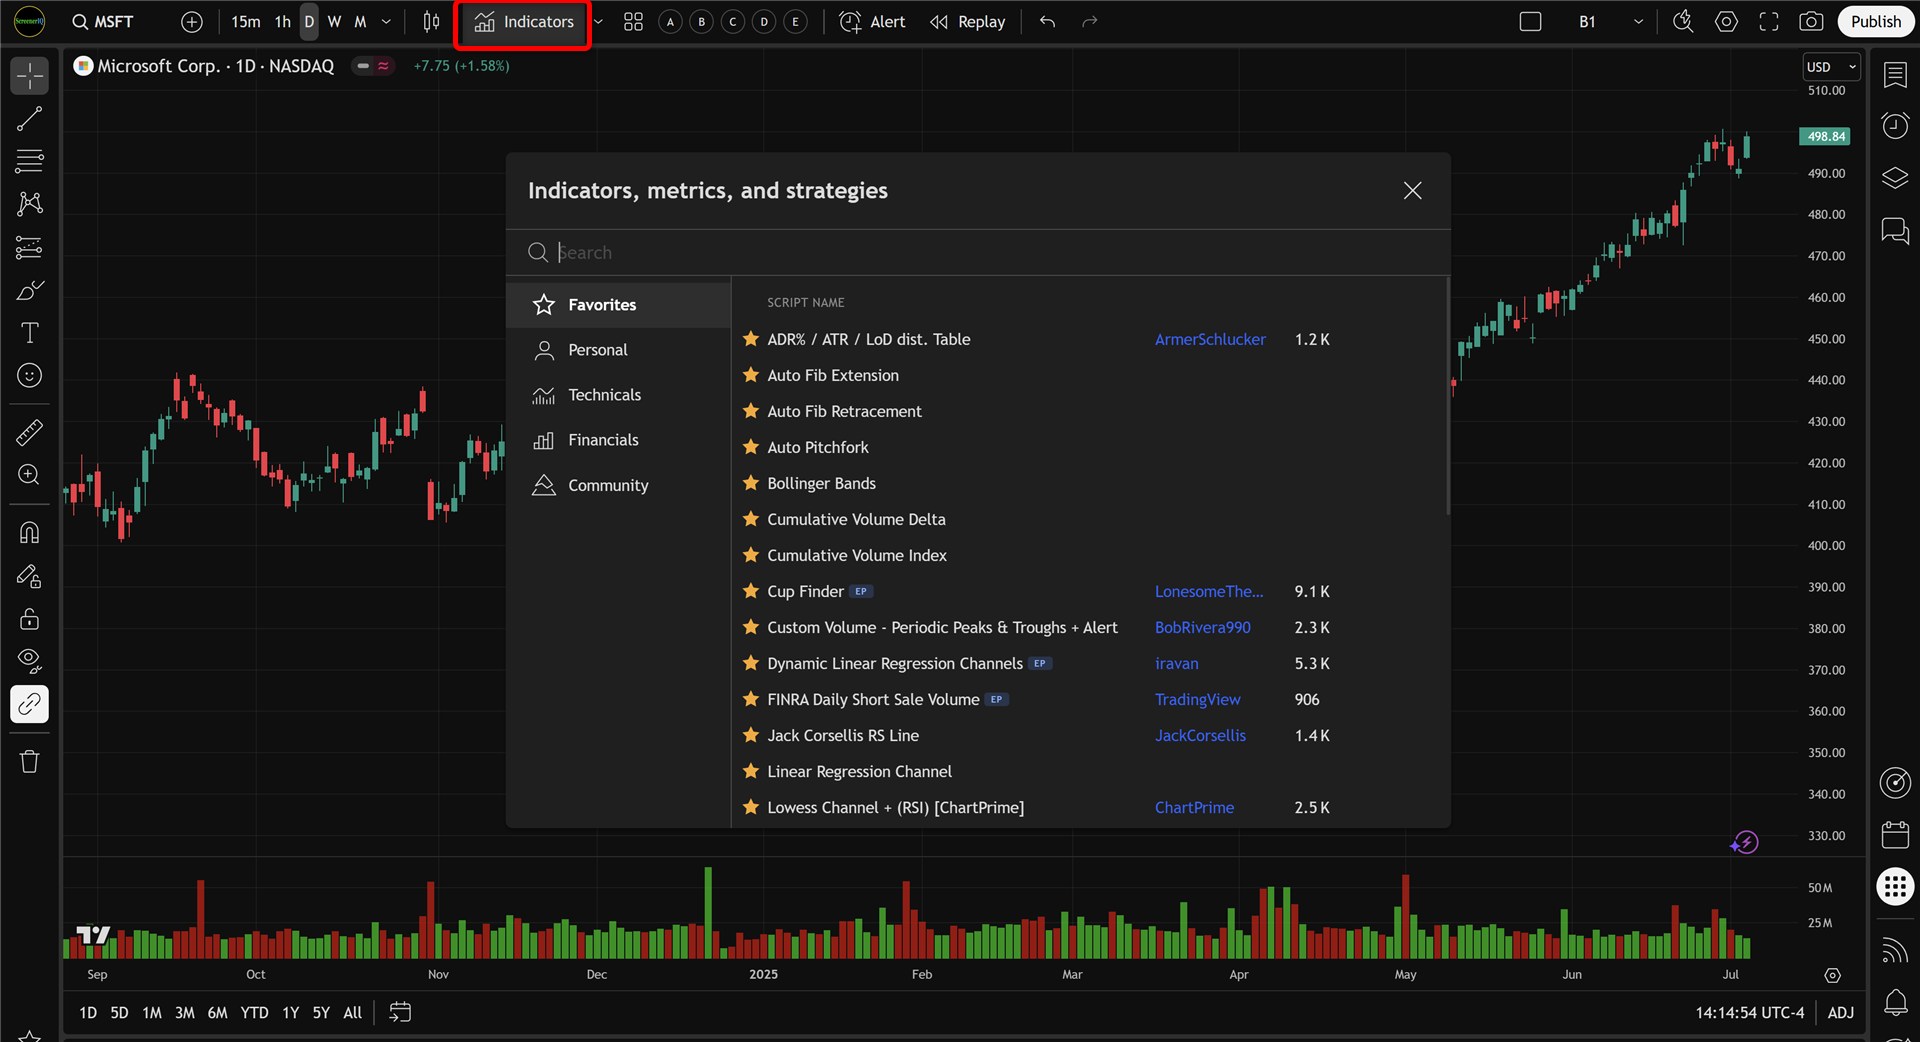
TradingView hosts thousands of built-in and community-created indicators accessible via the indicators window at the top of the chart. Here are some highlights:
- Ichimoku Cloud: Popular for trend and momentum analysis.
- Volume and VWAP: Essential for volume-based trading.
- IV Rank and Percentile: Useful for options traders to analyze implied volatility.
- Volume Profile: Shows volume distributed by price level rather than time, offering deeper insights into support and resistance zones.
- Footprint Charts: Rarely available outside professional futures platforms, footprint charts display buy and sell volume per candle, a must-have for scalpers and day traders.
- Market Profile (Time Price Opportunity): Combines volume and time spent at price levels to provide a sophisticated view of market structure.
One particularly handy feature is the automated chart pattern recognition.
By enabling the “All Chart Patterns” indicator, TradingView can automatically identify patterns like double tops, triangles, and head & shoulders, saving you the time of manually scanning charts.
Tradingview Alerts
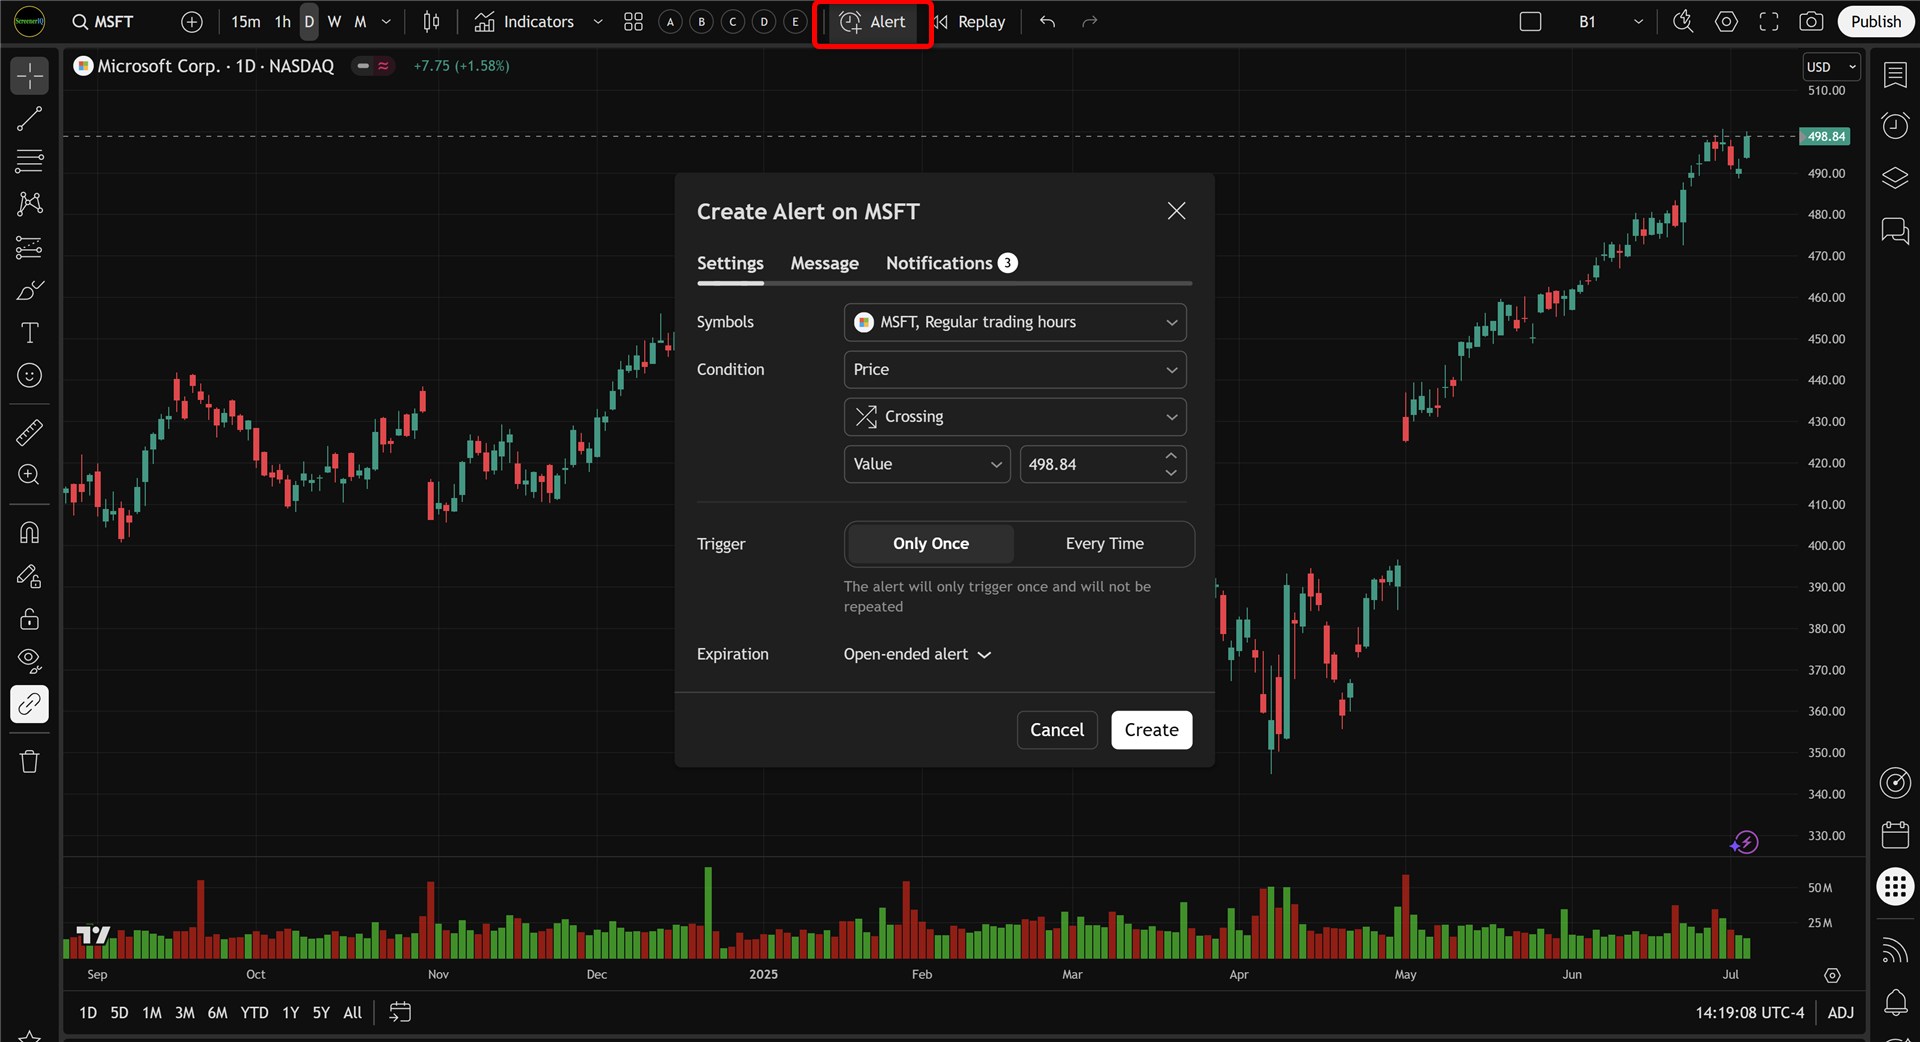
Setting alerts is simple and flexible. You can create alerts based on price crossing specific levels, indicator conditions, or even crossing trend lines and other drawing tools.
Alerts can be configured to trigger once or multiple times, with customizable expiration dates and labels, making it easy to manage multiple setups.
Chart Types
TradingView offers a wide variety of chart types to suit different trading preferences:
- Candlestick
- Bar Charts
- Line Charts
- Area Charts
- Heikin Ashi
- Hollow Candles
- Footprint Charts
- Market Profile (TPO) Charts
You can also compare symbols on the same chart, such as ETFs or stocks, and adjust for dividends using the adjustment button. This flexibility allows traders to analyze relative performance and correlations at a glance.
Tradingview Multiple Charts
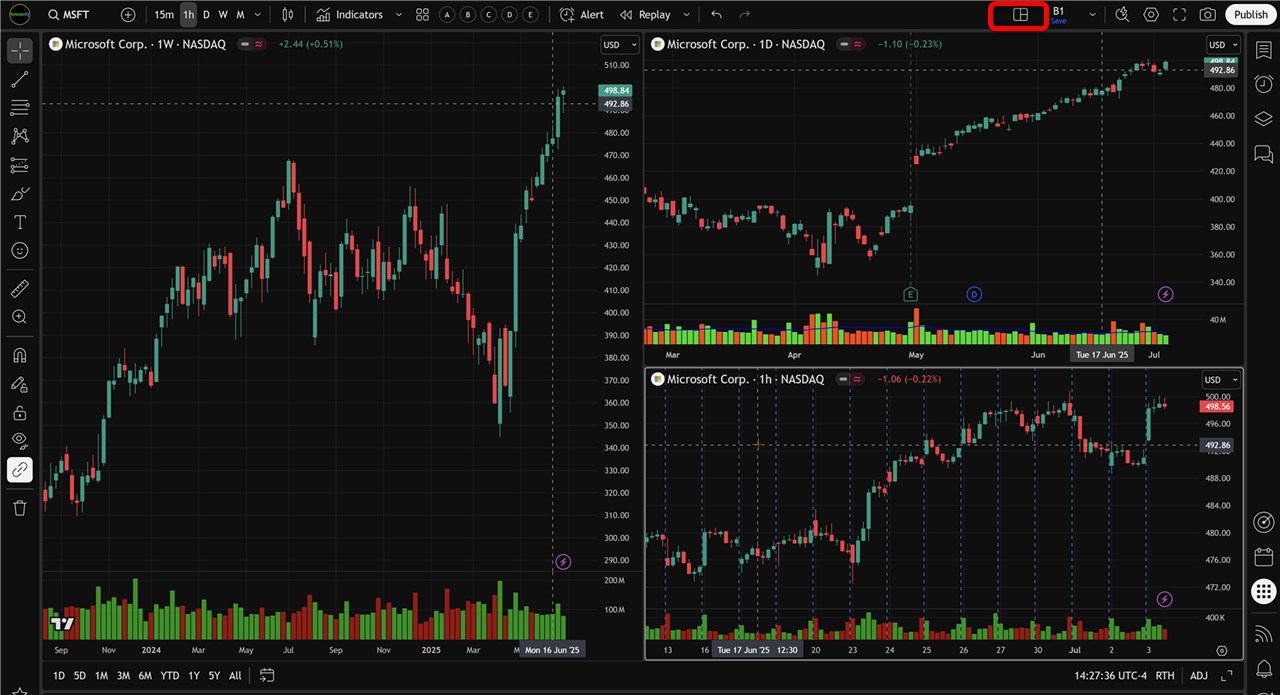
For traders who monitor several assets simultaneously, TradingView supports multiple charts per layout.
You can choose from various layout configurations—two charts side by side, grids of four or more charts, and more. This allows you to track different markets, timeframes, or strategies in one view.
Saving your chart layouts is crucial for efficiency. Once you set up your preferred indicators and chart types, you can save the entire layout under a custom name. TradingView will remember all your settings, so you don’t have to rebuild your workspace each time you log in.
Additionally, you can save indicator templates if you want to load specific indicator combinations quickly across different charts.
Tradingview Screener: Stock, ETF, and Crypto Screener
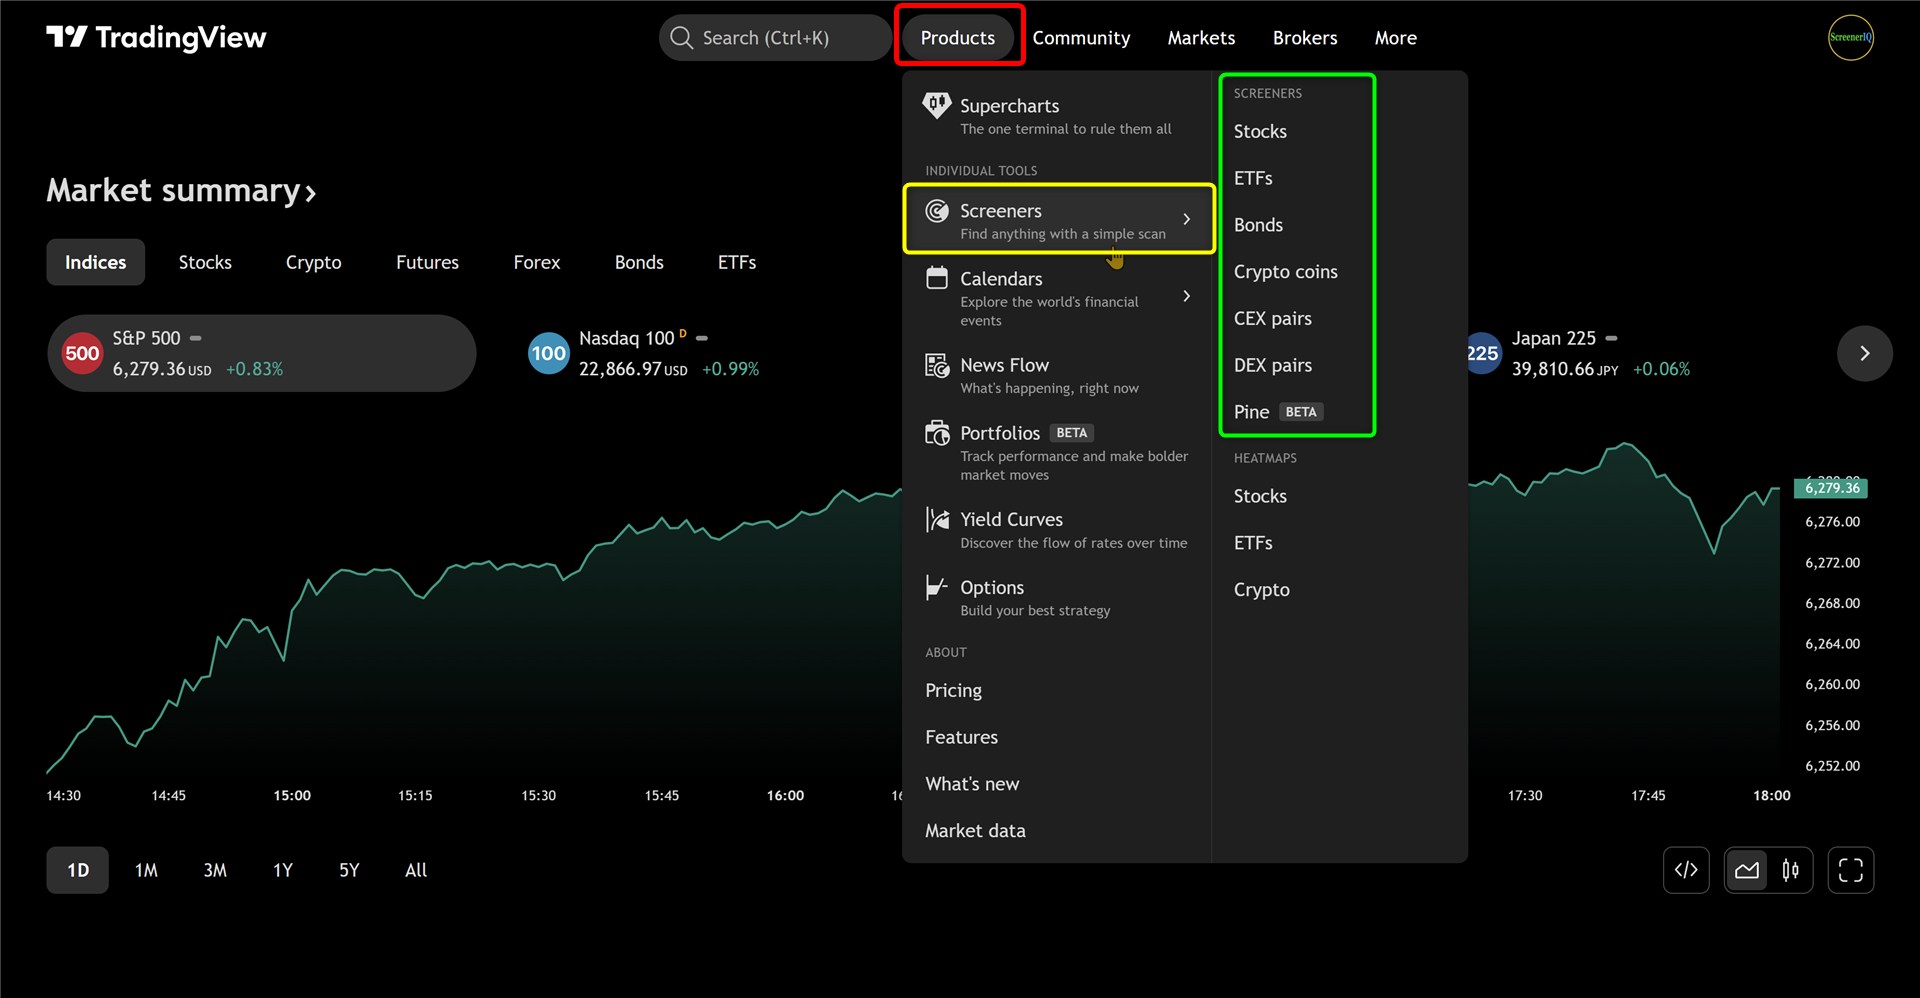
TradingView includes robust screeners for stocks, ETFs, bonds, and cryptocurrencies. These screeners let you filter assets based on a wide range of criteria, such as:
- Price-to-Earnings (PE) ratios
- Market capitalization (Mega cap, large cap, etc.)
- Dividend yield
- Sectors and industries
- Analyst ratings
- Expense ratios (for ETFs)
- Volume and transaction metrics (for cryptocurrencies)
For example, if you want to find potentially undervalued stocks, you can filter for those with a PE ratio below 14 and a market cap above $250 billion. The screener instantly displays stocks that fit your criteria, making it easier to identify opportunities without manually combing through lists.
You can also filter ETFs based on assets under management, focus areas, and whether they are leveraged. Crypto screeners allow filtering by market cap, volume, and price changes over different periods.
Tradingview Calendar: Economic, Earnings, and Dividend Calendars
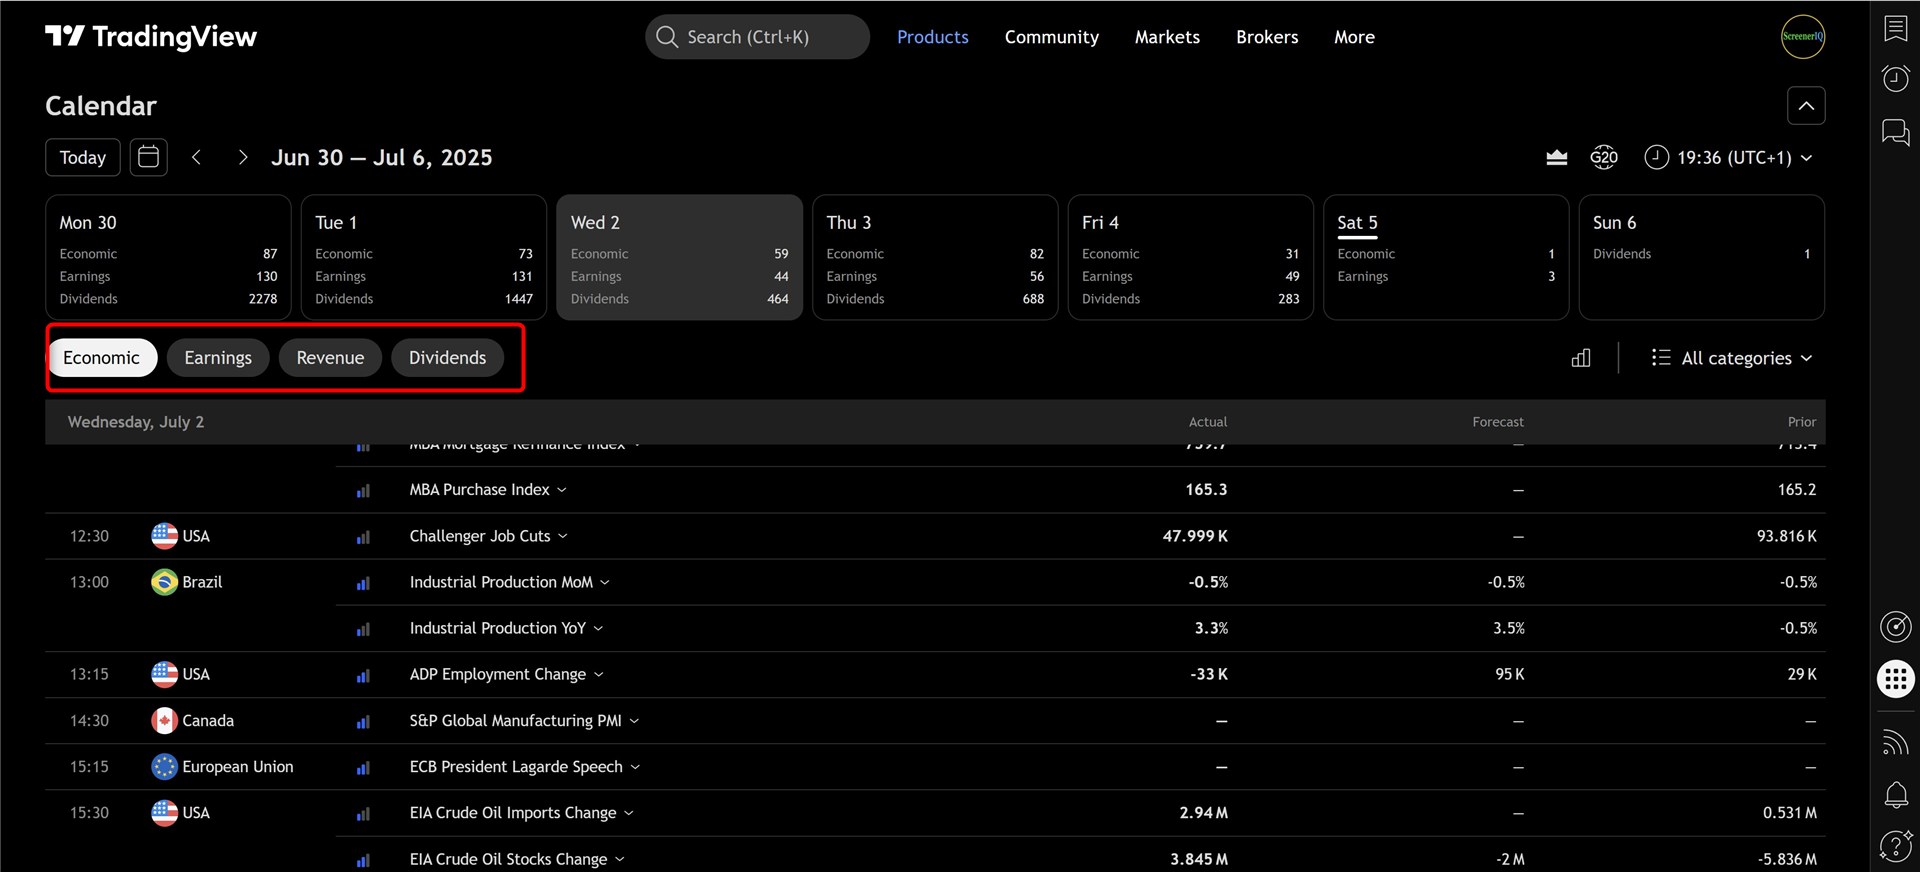
Another great feature TradingView offers is integrated financial calendars that track upcoming economic events, earnings reports, and dividend dates. These calendars help you stay informed about market-moving events without needing to leave the platform.
The economic calendar can be filtered by event type—GDP releases, bond auctions, inflation data, and more—and by country. This is especially useful for traders focused on specific markets or regions who want to keep an eye on relevant news.
You can access these calendars directly from charts via the sidebar, allowing you to see upcoming events alongside price action. This contextual information can help you anticipate volatility and plan trades accordingly.
Tradingview Heatmaps

TradingView’s heatmaps provide a visually appealing way to gauge market sentiment and momentum at a glance.
Available for stocks, ETFs, and cryptocurrencies, heatmaps display assets color-coded by performance—green for gains and red for losses—with size indicating market cap or volume.
You can customize heatmaps by filtering sectors, indices, and performance timeframes (daily, weekly, year-to-date).
This feature is especially useful for quickly spotting the biggest movers and sector trends without digging into individual charts.
Tradingview Watchlists
Keeping track of your favorite assets is simple with TradingView’s watchlists. You can create multiple watchlists or organize a single watchlist into sections to separate stocks, cryptos, or any categories you prefer.
Adding assets is as easy as clicking the plus icon and typing the ticker symbol. Right-clicking allows you to add sections, rename lists, share them, or delete them. This makes managing your portfolio or trading watchlist a breeze.
Tradingview Options Trading Features
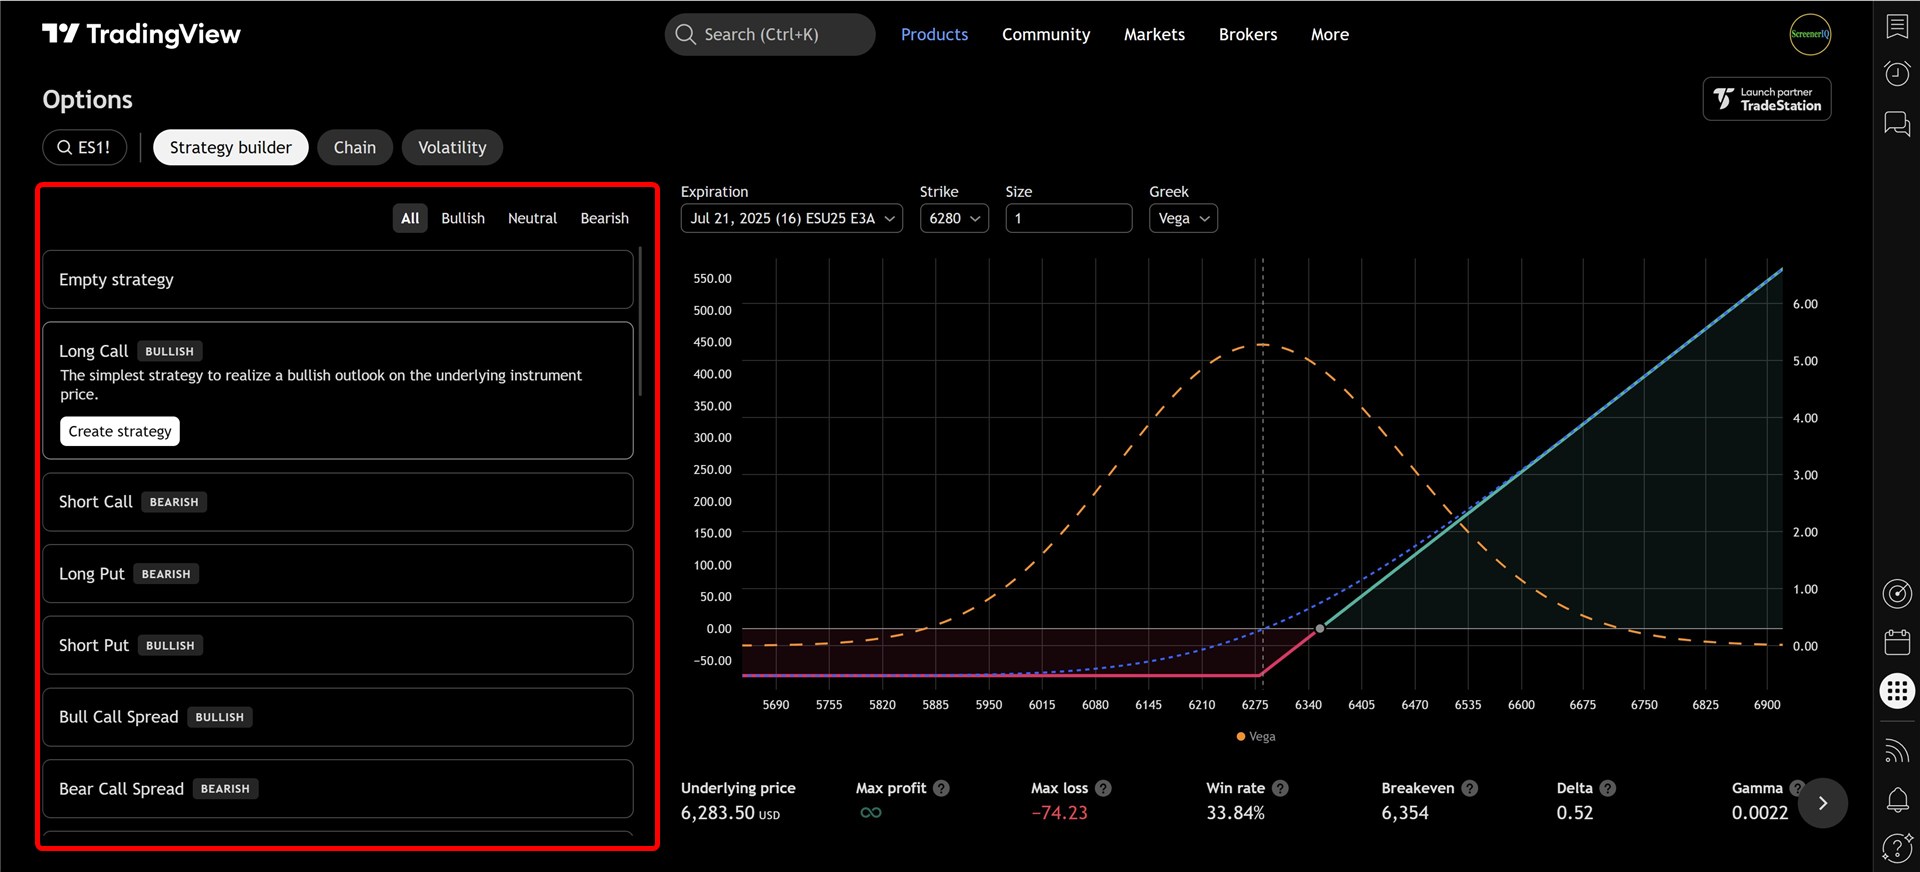
TradingView has recently introduced options trading features. You can view options chains for popular assets like SPY directly on the platform without needing a separate broker interface.
The options module includes:
- Real-time options chains
- Volatility curves
- Strategy builders with risk diagrams
TradingView options tools are a great way for quick analysis and strategy visualization. You can experiment with positions like long puts or spreads and see theoretical pricing and max loss figures.
Broker Integration and Trading Directly on TradingView
One of TradingView’s most powerful features is integration with multiple brokers, enabling you to trade directly from the charts. Supported brokers include:
- WeBull
- TradeStation
- Interactive Brokers
- Optimus Futures
- And more
This integration means you don’t have to switch between platforms to analyze and execute trades, streamlining your workflow.
Additionally, if you already pay for real-time data through your broker (e.g., Interactive Brokers), TradingView can use that feed directly, so you avoid paying twice.
Tradingview Backtesting and Paper Trading Features
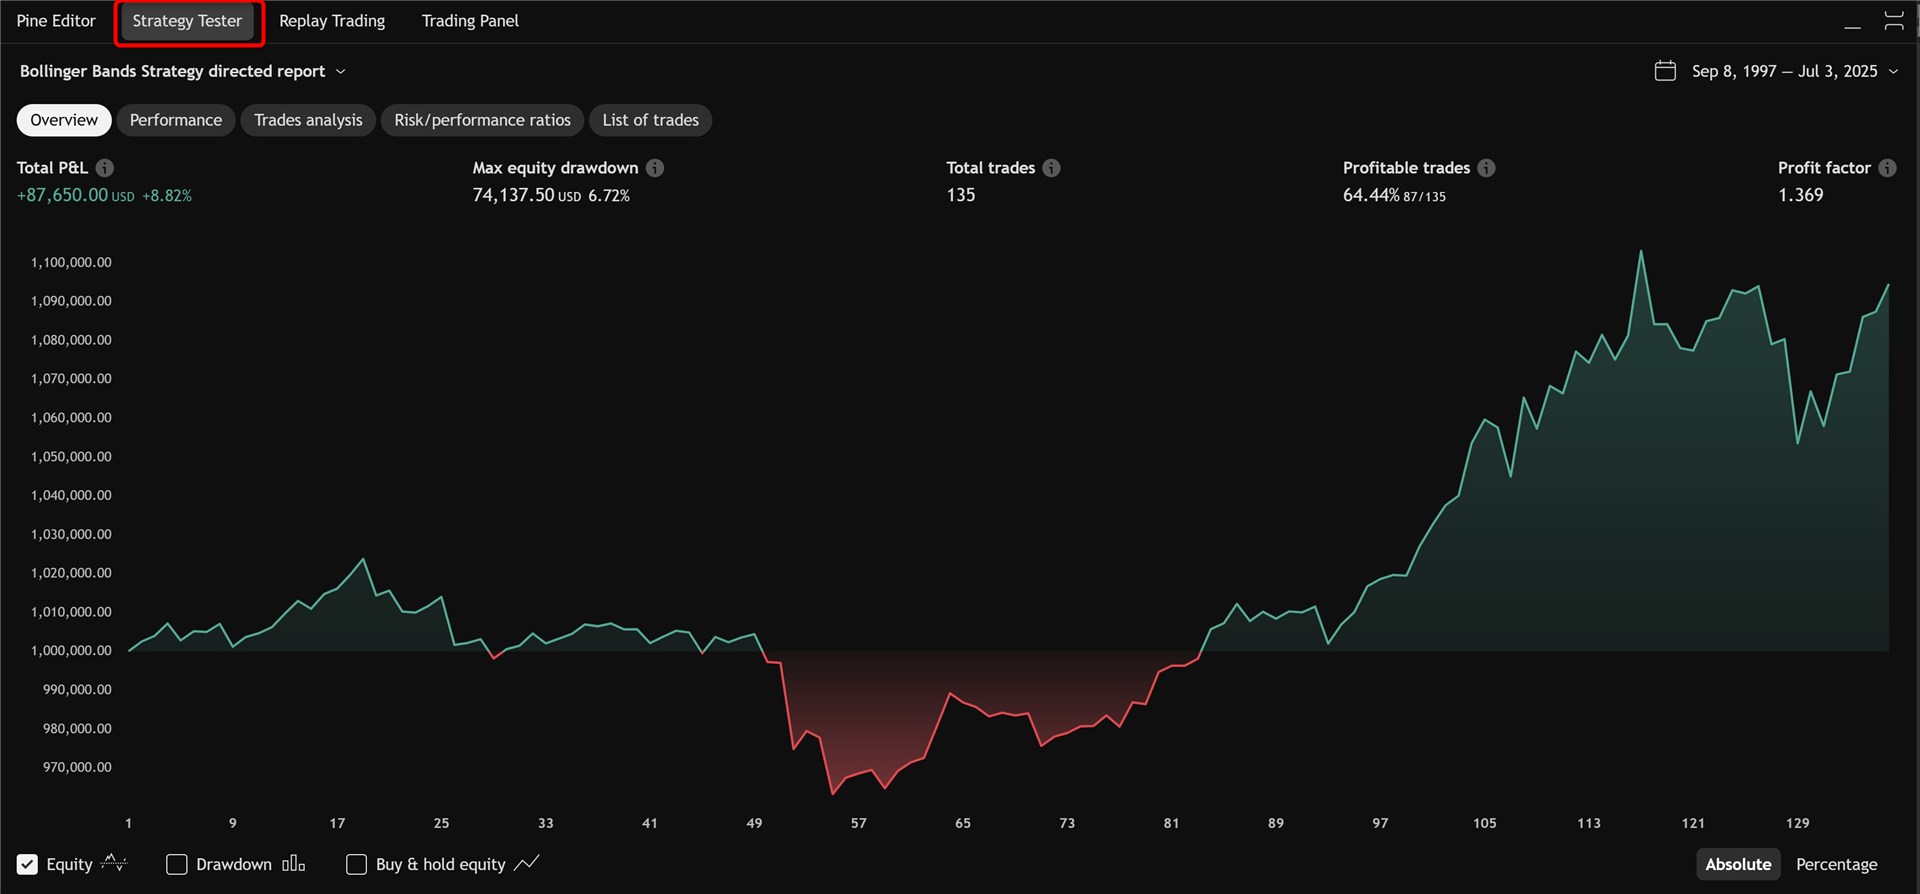
TradingView includes bar replay functionality that lets you backtest strategies by replaying historical price data.
You can simulate trades, study price action, and refine your approach. While not as advanced as some specialized backtesting software, it’s a handy feature for beginners and intermediate traders.
Paper trading tournaments are another community feature where traders compete using simulated money, sometimes for real rewards. This adds a social and gamified element to learning and practicing trading strategies.
Note that to backtest on lower timeframes (like one-minute charts), a premium account is required.
Tradingview Pros and Cons
Pros
- Powerful, intuitive charting with 400+ built-in indicators
- Extensive market coverage (stocks, forex, crypto, etc.)
- Real-time data on most assets without extra fees
- Extensive drawing tools and advanced indicators
- Community-driven custom indicators and scripts
- Integrated screeners, calendars, heatmaps, and watchlists
- Broker integration for trading directly from charts
- Options trading features and strategy builders
- Backtesting and paper trading capabilities
Cons
- Free plan limited to 2 indicators per chart
- Some advanced features require paid plans
- Learning curve for advanced features
TradingView Pricing
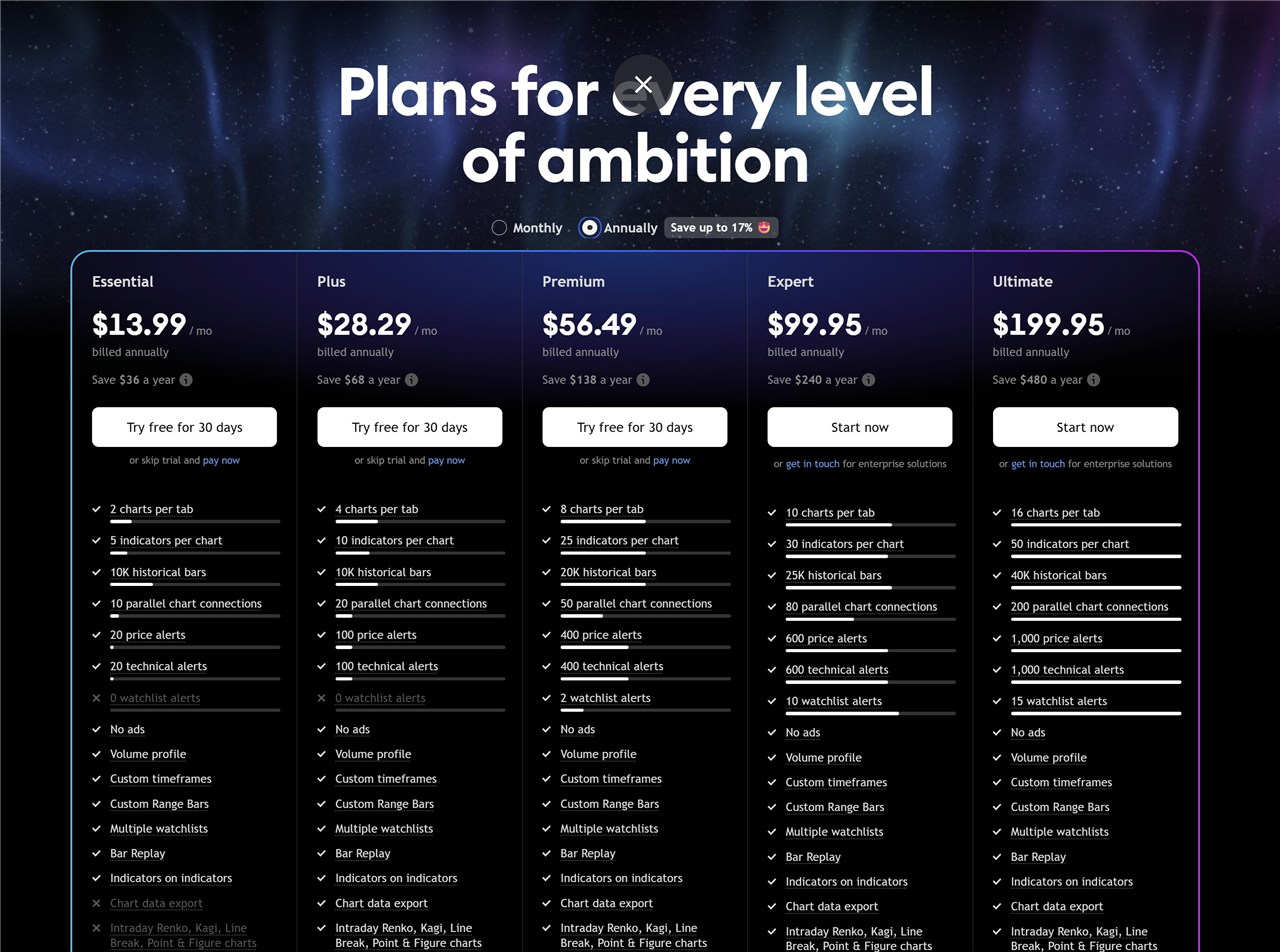
TradingView offers a range of plans, designed to fit different trader needs and budgets.
Price Plans
TradingView offers three main paid plans for non-professional traders:
- Essential: Adds more charts and indicators per layout.
- Plus: Further increases the number of charts, indicators, and watchlists.
- Premium: Includes all advanced features like footprint charts, market profile, volume profile indicators, and unlimited alerts.
Pricing ranges roughly from $13.99 to $56.49 per month depending on whether you pay monthly or annually (annual payments save about 16%).
Professional Plans
For institutional or professional traders, TradingView offers high-end plans that can cost between $200 and $600 per month. These include enterprise-level features, unlimited indicators, extensive alerts, and priority support. These plans offer the most comprehensive toolsets for serious market professionals.
As prices can change, see the latest Tradingview Price Plans.
Summary
★★★★★5/5After using TradingView extensively, I confidently recommend it as the best overall charting platform for both beginner and advanced traders and investors. Its rich features and real-time data, offers exceptional value.
The platform’s flexibility—from drawing tools and advanced indicators to screeners and broker integrations—makes it suitable for beginners and seasoned pros alike.
TradingView continues to evolve rapidly, adding new features and improving existing ones.
If you haven’t tried it yet, I suggest signing up for a free account and taking advantage of their 30-day free trial of paid features.
Try Tradingview For Free
You can try Tradingview for free for 30 days. Test it out and see if it suits your trading or investing style.
Frequently Asked Questions (FAQ)
Is TradingView free to use?
Yes, TradingView offers a free plan that includes one chart per layout, basic indicators, alerts, and real-time data for most assets when available. You can upgrade to paid plans for more advanced features.
What assets can I chart on TradingView?
TradingView supports a wide range of asset classes including stocks, ETFs, cryptocurrencies, futures, forex, bonds, and more—all accessible on a single platform.
Does TradingView provide real-time market data?
Yes, TradingView provides real-time data for many assets without additional fees. For some exchanges or professional data feeds, you may need to purchase real-time data or connect your broker’s feed.
Can I trade directly through TradingView?
Yes, TradingView integrates with several brokers such as WeBull, Interactive Brokers, TradeStation, and others, allowing you to place trades directly from the charts.
What are footprint charts and are they available on TradingView?
Footprint charts show detailed buy and sell volume at each price level within a candle, helping day traders and scalpers analyze order flow. TradingView offers footprint charts as part of its advanced indicators on paid plans.
Does TradingView have options trading features?
TradingView recently introduced options trading tools, including options chains and strategy builders, currently in beta. These features allow you to view options data and analyze strategies but are not yet a complete trading platform for options.
Can I backtest trading strategies on TradingView?
Yes, TradingView offers bar replay functionality for backtesting. You can simulate trades on historical data, although the backtesting tools are more basic compared to specialized software.
How do I save my chart layouts and indicators?
You can save entire chart layouts with all your indicators and settings, allowing you to quickly load your preferred setups. Indicator templates can also be saved separately for easy reuse.
Is TradingView suitable for beginner traders?
Absolutely. TradingView’s free plan and intuitive interface make it accessible for beginners, and its extensive educational resources and community scripts help users learn and grow.
Disclosure: We are reader-supported, and this article may contain affiliate links.